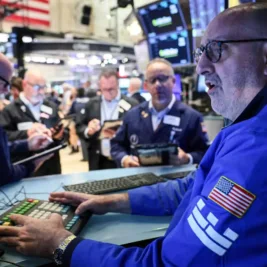

The S&P 500 is holding near its October record after a volatile stretch that revealed a widening gap between the headline index and the performance of many individual stocks.
The benchmark closed at 7,757.17 on October 21, roughly 0.8% below its record closing level of 7,818.93 set on October 6, according to Yahoo Finance data.
The index had gained about 13% in 2026 as of the October 22 report, even after the Federal Reserve raised its benchmark interest rate in September for the first time in more than three years.
Index Strength Masks Weakness Beneath the Surface
The headline level hides substantial weakness among constituents.
Seeking Alpha reported that 36% of S&P 500 members were trading at least 20% below their 52-week highs on October 6, the same day the index reached its record close.
Yahoo Finance also reported that the S&P 500 lost roughly 2% during the week covered by its October 17 analysis, ending near 7,659.
That decline erased the index's breakout above the previous August peak, while the Nasdaq Composite fell approximately 4.5% over the same period.
Technology stocks and several earlier market leaders saw particularly steep reversals.
Nvidia and the Technology Select Sector SPDR Fund fell back below prior record levels, while Palantir ended the week down roughly 11%, confirming a correction after briefly reclaiming its November record.
According to Yahoo Finance calculations, 18 of the S&P 500's 20 biggest weekly decliners had ranked among the index's 100 strongest performers between March 30 and October 6.
Dell Technologies and Hewlett Packard Enterprise, which had each more than tripled during that advance, both lost over 20% in the following week.
The broader market nonetheless showed signs of resilience.
Approximately 72% of S&P 500 constituents ended the week higher, while the Invesco S&P 500 Equal Weight ETF gained roughly 0.5%.
The equal-weight fund limits the influence of the largest companies, highlighting gains among stocks that carry less weight in the traditional index.
Yahoo Finance found that the 100 strongest S&P 500 stocks from March 30 through October 6 lost roughly 5% on average during the analyzed week, while the 100 weakest gained approximately 4%.
Market levels remain central to the near-term outlook.
Yahoo Finance identified roughly 7,800 for the S&P 500 and 27,200 to 27,300 for the Nasdaq as important thresholds for a potential recovery after the failed breakouts.
A separate historical analysis published by Yahoo Finance on October 22 examined years when the S&P 500 stood within 1% of its record on October 21.
Across 16 qualifying years from 1928 through 2025, the index established at least one new record closing high before the end of each year.
The sample included 1928, 1958, 1961, 1963, 1964, 1965, 1968, 1993, 1995, 1996, 2013, 2017, 2019, 2021, 2024 and 2025.
In 1965 and 2013, the next record arrived on the following trading day, while the 1993 market did not surpass its previous closing high until December 27.
Expanding the selection to years when the index stood within 1.5% of a record added 1980, 1982 and 1997, all of which also recorded a new closing high before year-end.
Reaching another record did not guarantee a strong finish, however.
The index rose between October 21 and the final trading day of December in 14 of the 16 original cases, while 1964 and 1968 ended lower over that period.
In 1968, the index recorded 10 additional closing highs after October 21 and peaked on November 29 at approximately 3% above its October 21 level, before falling to roughly 4% below that November peak by December 31.
The analysis noted that the 1928 figures came from the predecessor Composite Stock Index, which tracked 90 stocks, rather than the 500-stock S&P 500 introduced in March 1957.
All historical comparisons measured price changes without dividends.