
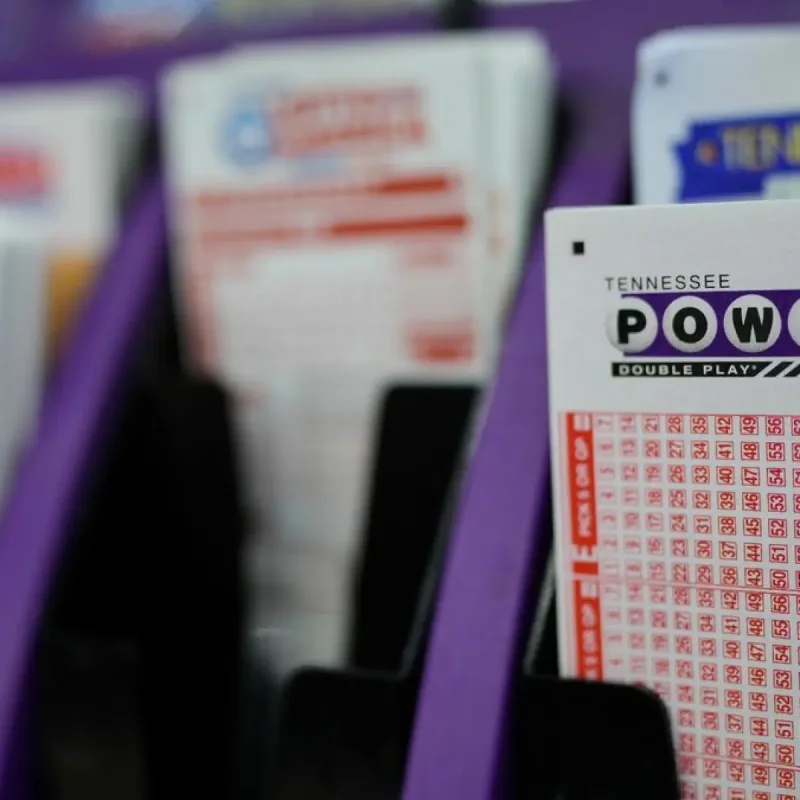
Multiple historical data studies released by July 9, 2026, have identified the top lottery-winning locations across the United States, tracking decades of jackpots and single-day performances.
The findings highlight significant regional discrepancies in both total wins and per-capita success rates.
Top States for Jackpot Wins
Michigan emerged as a premier location for jackpot winners, recording 46 total jackpot wins and averaging 98.4 wins per million residents.
New York and California ranked third and fourth for total volume, driven largely by their massive populations and ticket sales.
An online gaming research platform described Michigan as "the most balanced high-performing state."
The platform also highlighted Virginia's high per-capita performance, stating it is "leading the nation in per-capita performance, reaching 100 wins per million residents."
Analysts noted that Virginia outpaced much larger regions due to consistent historical consistency.
The same report identified Maryland, with 6.2 million residents, as "one of the most reliable states overall."
Single-Day Prize Money Leaders
A separate five-year study focused on historical results from July 17 showed that Florida secured the top spot nationally for single-day prize money, drawing $10.92 million across 2,195 winning tickets.
Texas followed as the second-luckiest state for that specific date with $6.32 million in total prizes from 990 winning tickets.
Frisco, Texas, ranked as the state's luckiest city after generating $1.033 million in winnings. On a local level, Danvers, Massachusetts, claimed the title of the luckiest U.
S. city for the July date, accumulating $2.6 million in prizes.
Retail data showed that major convenience and grocery chains dominated ticket distribution.
One prominent grocery brand secured $3.22 million across 454 winning tickets, while a major convenience brand led in volume with 468 winning tickets.
Expert Perspectives on Lottery Odds
Amy Harris, a research team member, discussed the underlying mechanics of lottery operations. "In real gaming, the odds are fixed," said Harris.
She suggested that geographic factors could correlate with different historical results, adding, "where you play can change the outcome."
Representatives from the Multi-State Lottery Association disputed the idea that geographical location alters mathematical probabilities.
"Where you buy a ticket has no impact on your chances of winning the jackpot," said the association.
They stated that higher concentrations of winners are tied to population density and sales volume, noting, "We typically see more prize winners in urban areas than in rural areas simply because more tickets are sold there."
Philip J. Cook, professor emeritus at Duke University, expressed skepticism regarding consumer interpretations of geographic lottery data.
"Some readers may conclude that they are more likely to win if they buy their next ticket in Michigan or Virginia.
That would be quite a scandal," said Cook.
Cook noted that historical evaluations must account for chronological variations in state participation. He pointed out that structural formatting changes over time have fundamentally shifted the probability landscape.
"So the likelihood of a winning ticket was higher in the early years than subsequently, which will affect the historical count of winners," said Cook.
Cook concluded that per-capita population adjustments do not fully reflect true ticket probabilities.
"So it appears to me that there's a lot more work to be done before concluding that any one ticket sold in Michigan has a better chance than one sold anywhere else," said Cook.